Assigning subjects to treatment and control groups randomly is called random assignment. Although random assignment creates a statistical expectation that the characteristics of the two groups will be the same, it has a remarkably high failure rate.
This is particularly a problem in meta-analysis, where effect sizes are typically calculated using the difference in effect between the control and treatment groups at the end of a study without regard to baseline differences between the groups. Meta-analysis accepts this because of the expectation that randomization will make the groups equal at baseline.
To test whether this is a reasonable expectation, we can write a small R program that repeatedly creates two equal-size groups of random numbers from a normal distribution with a mean of 0 and a standard deviation of 1. Then we calculate the percentage of cases in which the difference between the two groups is “unequal.”
In their original work on effect sizes, Cohen and Cohen suggested that a small effect size was a difference of .2 standard deviations. In the following study, I use three definitions of inequality — a difference in effect more than a tenth, more than a quarter, and more than a half of a small effect size.
For this study, “repeatedly” means 100,000 trials. In the following table, the first column shows the size of each group. (The total number of subjects in an experiment would be twice the group size.) The following columns show the percentage of those 100,000 trials that weren’t actually equal, as opposed to expected to be equal, under the three definitions.
| Group n | ‰ > a tenth | ‰ > quarter | ‰ > half |
|---|---|---|---|
| of a small effect | |||
| 20 | 95 | 87 | 75 |
| 40 | 93 | 82 | 65 |
| 60 | 91 | 78 | 59 |
| 80 | 90 | 75 | 53 |
| 100 | 89 | 72 | 48 |
| 200 | 84 | 62 | 32 |
| 300 | 81 | 54 | 22 |
| 400 | 78 | 48 | 16 |
| 500 | 75 | 43 | 11 |
| 600 | 73 | 39 | 8 |
| 700 | 71 | 35 | 6 |
| 800 | 69 | 32 | 5 |
| 900 | 67 | 29 | 3 |
| 1000 | 65 | 26 | 3 |
| 1100 | 64 | 24 | 2 |
| 1200 | 62 | 22 | 1 |
| 1300 | 61 | 20 | 1 |
| 1400 | 60 | 19 | 1 |
| 1500 | 58 | 17 | 1 |
Here’s what the results look like in a plot:
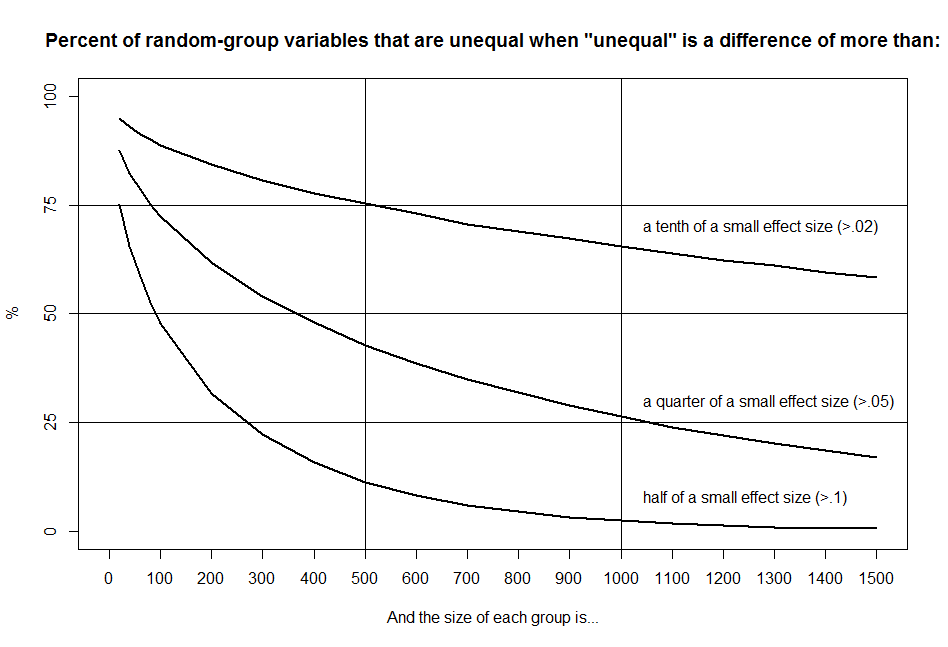 As you can see, the actual failure rate is too high to assume equality at baseline, particularly for studies with fewer than 500 subjects per group, which is common in both health and psychological studies.
You can think of the failure rate as the probability that two groups will be unequal on a particular group characteristic or variable, or as the percentage of group characteristics that will be unequal.
In either case, to get below a 5% failure rate, you have to define “unequal” as a difference of more than half of a small effect size and have group sizes of 800 or more.
In the results of actual studies, researchers deal with this issue by including group differences at baseline in the statistical analysis. There are several different ways to do this, which I’ll discuss in an upcoming post but there is little agreement on which of these is the best.
In meta-analysis, on the other hand, the common formulas and online calculators don’t even consider group differences at baseline, which is a major statistical issue. In Estimating Effect Sizes from Pretest-Posttest-Control Group Designs, Scott B. Morris examined methods for including baseline data in effect-size calculations for means. The article appears in the April 2008 edition of Organizational Research Methods. In another upcoming post, I’ll discuss what Morris found.
Here’s the R code for the random-assignment failure rate test discussed in this post:
set.seed(9999L)

calcDeltas = function(Tn, Gn, mu=0, sd=1) {
# create vector for group differences per trial
   r=rep(0,Tn)
# calculate difference in sds for each trial
   for(i in 1:Tn) {
      r[i] = abs(mean(rnorm(Gn,mu,sd)) -
                 mean(rnorm(Gn,mu,sd))) / sd
   }
# calculate failure rate and return as a percentage
   x = c(sum(r>.02)/Tn, sum(r>.05)/Tn, sum(r>.1)/Tn)
   return(x*100)
}

# number of repetitions
Tn = 100000

# groups sizes for table
GnSet = c((1:4)*20,(1:15)*100)

# set up results table
r = data.frame(Gn=GnSet,
           tenthOf=as.numeric(NA),
           quarterOf=as.numeric(NA),
           halfOf=as.numeric(NA))

# for each group size...
for(Gn in GnSet) {
   x = calcDeltas(Tn, Gn)
   r[[r$Gn==Gn,"tenthOf"]] = x[1]
   r[[r$Gn==Gn,"quarterOf"]] = x[2]
   r[[r$Gn==Gn,"halfOf"]] = x[3]
}

View(r) # view table

# plot results
plot(r[,c(1,4)], xlim=c(0,1500), ylim=c(0,100),
                 xaxp=c(0,1500,15), yaxp=c(0,100,4),
                 type="l", lwd=2,
                 main='Percent of random-group variables that are unequal when "unequal" is a difference of more than:',
                 xlab="And the size of each group is...",
                 ylab="%")
lines(r[,c(1,3)], type="l", lwd=2,
                 xaxp=c(0,1500,15), yaxp=c(0,1,10))
lines(r[,c(1,2)], type="l", lwd=2,
                 xaxp=c(0,1500,15), yaxp=c(0,1,10))
text(x=c(1025),y=c(8,30,70), pos=4,
         label=c("half of a small effect size (>.1)",
                 "a quarter of a small effect size (>.05)",
                 "a tenth of a small effect size (>.02)"))
abline(h=c(25,50,75))
abline(v=c(500,1000))